

The time preceding the 1987 stock market crash bears many similarities to the current environment; notably the raging bull market in equities, high bond prices, low stagnant global economic growth and a loose monetary policy that flooded the market with cheap money. George Soros writes about is trading activity around this time in his book “The Alchemy of Finance’ and highlights that even then, the natural cycle of self perpetuating booms/busts were being tampered with by central bank intervention, making it difficult to trade. So what can we draw from the similarities and differences in today’s macro landscape?
New phase of global credit contraction
In order to save the economy central banks bought trillions of dollars of securities from the financial markets in exchange for cheap credit which was as good as cash, hoping that this would be spent and trickle down into real economic growth. Now that the global economy appears to show signs of growth they plan to offload the assets. The Fed will gradually sell its $4.5 trillion of assets back to banks, which will take cash out of the market and starting the cycle of credit contraction. The EU & UK will follow when their economies pick up.
The reduction in credit/cash in the market should be offset by the prospects of real economic growth. The higher interest rates should help to combat inflation caused by such economic growth. However, it seems that the central banks have to decided to talk about this in a time when inflation is not near their required 2% target and global growth is minute and rather fragile. If central banks begin to unwind their balance sheets badly it could threaten financial recession and collapse of financial markets.
In the 1987 crash, the expansionary cycle of credit came from a boom in international lending. If companies began to struggle to pay the interest on loans, they could borrow more cheap debt to keep up with payments. This cycle requires more and more debt to fuel it and eventually the creditors begin to question the financial stability of its debtors. This usually requires some sort of catalyst as lenders who are enjoying the raging bull markets ignore sound lending behaviour as they chase quick profits. In 1987, this catalyst was the collapse in oil prices that forced many debtor nations and debtor companies into defaulting. This set in motion a contraction of credit, which led to the collapse of an overly inflated equity market.
In today’s market, the credit expansion has been a direct result of central bank ultra loose monetary policy and trillions of dollars of quantitative easing. Instead of a natural cycle of boom/bust, it is in fact the central banks themselves who are actively deciding to rein in the credit expansion and turn towards credit contraction.
Normalizing quickly could cause market instability, what factors could force unexpected changes in policy?
Firstly, central banks aim to gradually unwind the balance sheet, whilst being transparent to the market about their plans as to avoid violent reactions. If the banks unwind too slowly, it may force them to react quickly and in bigger moves later down the line, as they have to react to market forces like exchange rates or inflation more quickly.
Unwinding large asset purchase programs can look bad politically, thus forcing a change in strategy.* This is because naturally the central banks will want to unwind the balance sheet when the markets recover and interest rates have started to rise. Janet Yellen has been clear that they will only unwind the balance sheet once the federal rates normalize first. This means that bond prices will be lower and thus they make a loss. Their overall objectives have been accomplished, but in the public eye politicians may draw on this “loss” to highlight the failure of the policy and force it to abandon gradual QE measures in favor of diminishing it as soon as possible. This is particularly relevant in the case that Donald Trump has already made his dislike of QE known and wishes to reduce the balance more quickly. We should be on the look out for changes in the Fed’s members and political pressure from the President.
Inflation has been at the heart of investors concerns with balance sheet normalization. If inflation rises it may force the central banks to raise rates and fasten their unwinding of the balance sheet. A weakening dollar, Trump’s protectionist views and rising commodity prices could cause inflation to rise quicker than anticipated and forcing abrupt movements in Feds balance sheet normalization.
Inflation has not posed a huge threat as of yet due to low economic growth, collapse in oil prices and globalized competition in technology & labour markets. The reduction of slack in the labour market should normally lead to inflation. US unemployment is around 4% and would normally lead to greater upward pressure on wages, thus upward pressure on costs for business and the cycle leads to inflation. In their annual report, the BIS* (Bank of International Settlements) discuss the recent decades of globalization and technological advances creating more competition in global labour markets, leading to less pressure on wage growth even when there is near full employment. This helps to further explain why, in a seemingly strong labour market and signs of economic growth there has been little inflation. We may need to look at other indicators to check if inflation is due to rise, like a cyclical bull market in commodity prices for example. The recent collapse in oil has created headwinds for company and helped keep inflation low. Perhaps with oil prices rebounding, a cyclical change in commodity bull markets could be the key to spotting spikes in inflation.
What are the knock on effects of balance sheet normalization?
Rapid sell off in riskier assets that were fueled by credit like equities and corporate bonds. The longer the central banks encourage a loose monetary policy, the longer markets will allocate cheap cash to risky assets and further inflate prices beyond true values. Bank sheet normalization could force a flight to safety and see those markets crash, particularly in the US/UK and Europe. We will have to see how these markets sell off at different stages of the central bank announcements to get a sense of the severity of these sell offs.
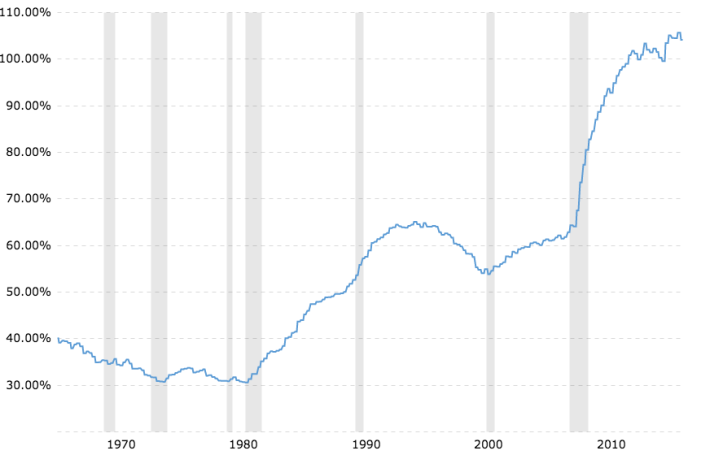
Global debt has been rising sharply, can it cope with higher interest payments? Global debt has been rising particularly due to responses of authorities in dealing with the financial crisis of 2008 and continued poor economic growth since. This has been manageable in times of low interest rates where the repayments are low. If the balance sheet normalizations begin, interest rates rise and so does the amount these governments and companies will have to pay back. This is particularly the case for those countries who are running budget & trade deficits who finance it through debt and have large national debt figures. This could destroy growth and send shockwaves through markets. The below chart*** shows the meteoric rise in Debt to GDP for the Fed in the US.
Emerging markets have binged on dollar debt and now face a shock with higher interest payments. The BIS quarterly review indicates that US dollar credit to non-bank borrowers outside the US stands at $10.5 trillion in Sept 2016. That is a hefty amount which will have a rude awakening when their interest payments start rising. Is the global economy actually ready for that increased debt burden and will that force us back into recession?
1987 vs 2017
They may be under different backdrops but 1987 contraction of credit is similar to what we are seeing happen today. The world owns $10.5 trillion of dollar debt, who are about to experience a rise in their debt burden at the exact same time that their access to cheap credit is disappearing.
In an inflationary cycle of credit expansion higher debt burdens can be mitigated by borrowing more cheap debt. However, the central banks are cutting off that cheap debt flow and thus there is huge potential for companies and countries to default on their debt. This is what happened in the lead up to the 1987 crash.
Perhaps the biggest difference in 2017 is that the central banks can delay this process for longer in the desperate hope that economies catch up in real growth. The longer they wait the larger asset bubbles get, the more reliant the world becomes on cheap debt. When the central banks start to reverse, even if its slowly, it could set in motion a self reinforcing vicious reversal.
by Alfie Marsh, 5th September 2017
*http://www.bis.org/publ/arpdf/ar2017e_ec.pdf
**http://www.macrotrends.net/1381/debt-to-gdp-ratio-historical-chart
*** https://fred.stlouisfed.org/series/GFDEGDQ188S

[…] few words on how the cycle of credit often creates financial crisis’. In a time of expansion and growth, banks and lenders are […]
LikeLike
[…] indicates a new era of credit contraction, which sets the tone for the next financial cycle. Markets have been propped up on the basis of […]
LikeLike